Measuring Summertime Land Surface Temperatures
A brief explanation of this project and our process.

Collaboration with our on-staff meteorologist
I lead the initiative by discovering the data and analyzing it. Anthony added his expertise on climate and the San Antonio region. Together, we produced this piece, intended as the first of three.

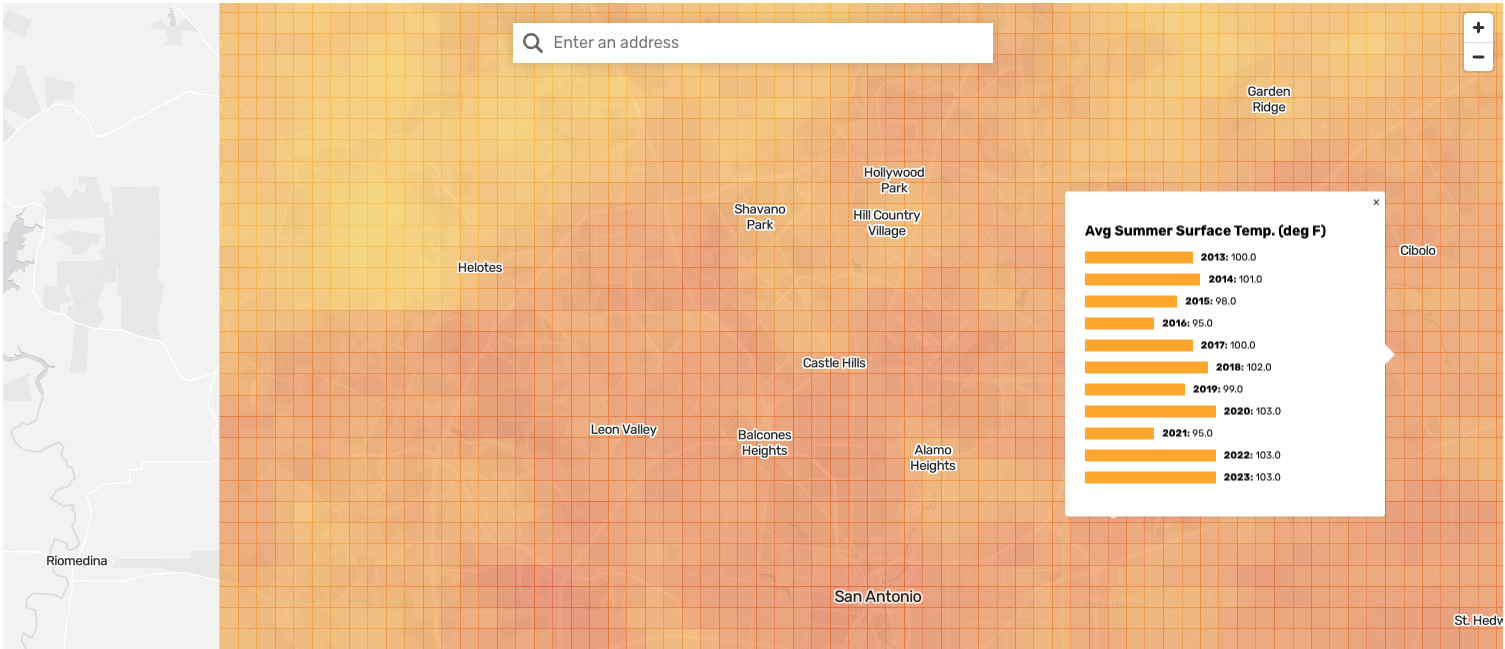
Here we've built an interactive map that provides the user with an address search bar and an HTML-styled tooltip that indicates the surface temperatures at that site over the last ten years. We harness the power of raster data in a way that makes the data come alive.
The underlying searchable map is a proprietary product Hearst has built on a Gatsby platform with React. It pulls information into the map from a Google Sheets document.
Project Methodology
Code blocks and methodology available here.
Here's a slide deck I produced summarizing the findings of my analysis: